Heatmap
dplabtools offers a dedicated heatmap class for visualizing WSI inference results performed by the WSIInference
class.
WSIHeatmap class features include:
Configurable color or transparency for image background.
Configurable color map, data range, and transparency for visualized data.
Saving in different image formats, along with embedded resolution information.
Saving as overlays with a cut-off point.
Support for custom drawing functions for labels or watermarks added to saved images.
Basic usage
Assuming that the variable inference represents a WSIInference object:
from dplabtools.slides.processing import WSIHeatmap
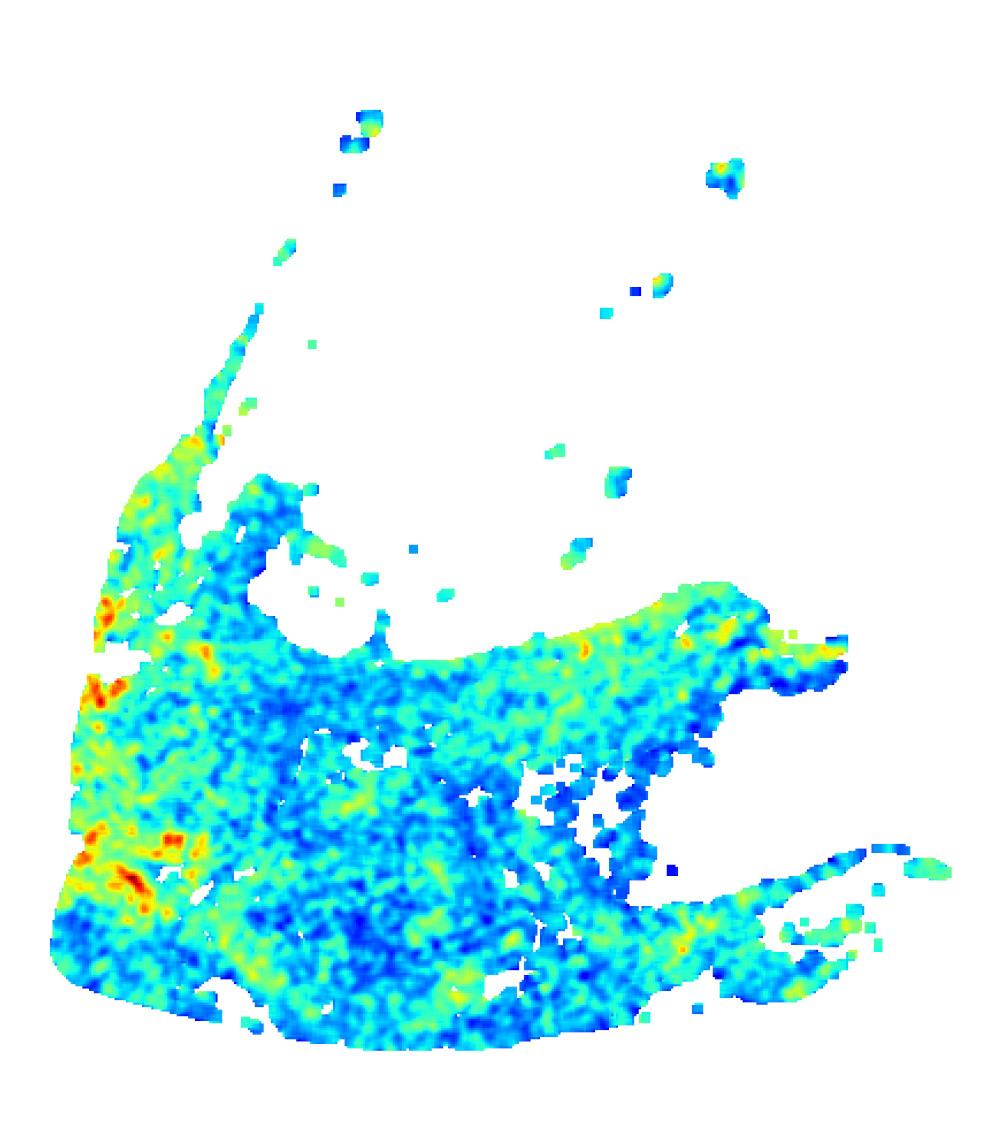
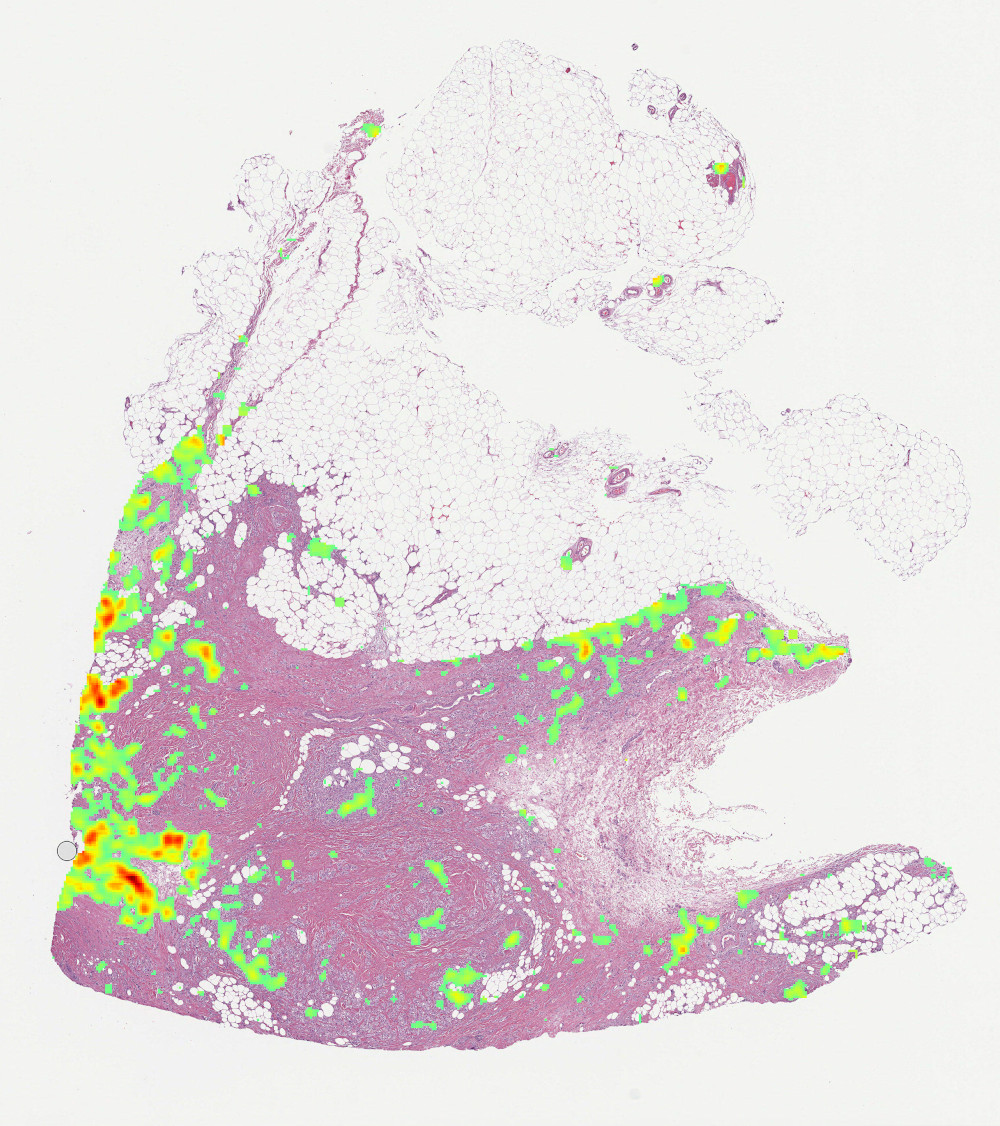
heatmap = WSIHeatmap(heatmap_data=inference.classes_array[0])
heatmap.save_png("heatmap1.png")
Output (heatmap1.png):
Class details
- class dplabtools.slides.processing.WSIHeatmap(...)
Class for visualizing inference results.
- Parameters:
heatmap_data (NumPy array) – One class data from
WSIInference.background_color (str, default="white") – Color representing heatmap image background.
Nonewill produce a transparent background.color_map (str, default="jet") – Color map used for visualizing data.
alpha (float, default=1) – Value representing the heatmap image transparency.
vmin (float, optional) – Data range covering the heatmap image.
vmax (float, optional) – Data range covering the heatmap image.
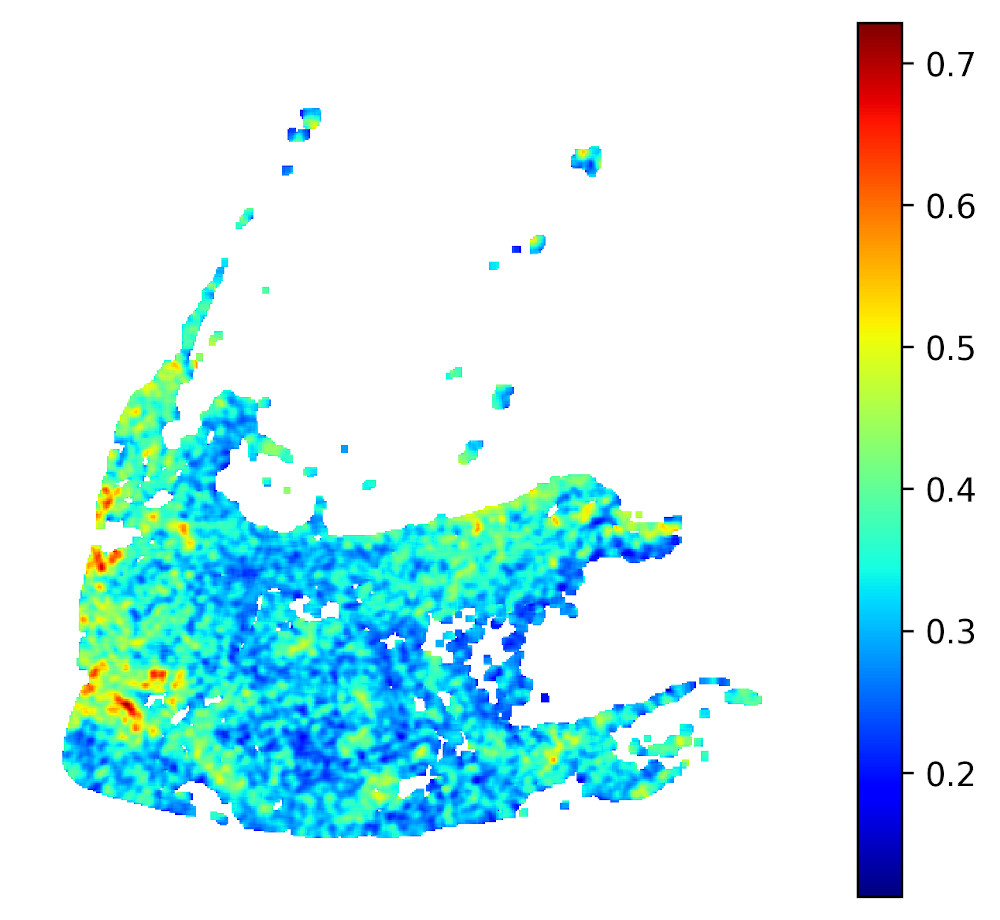
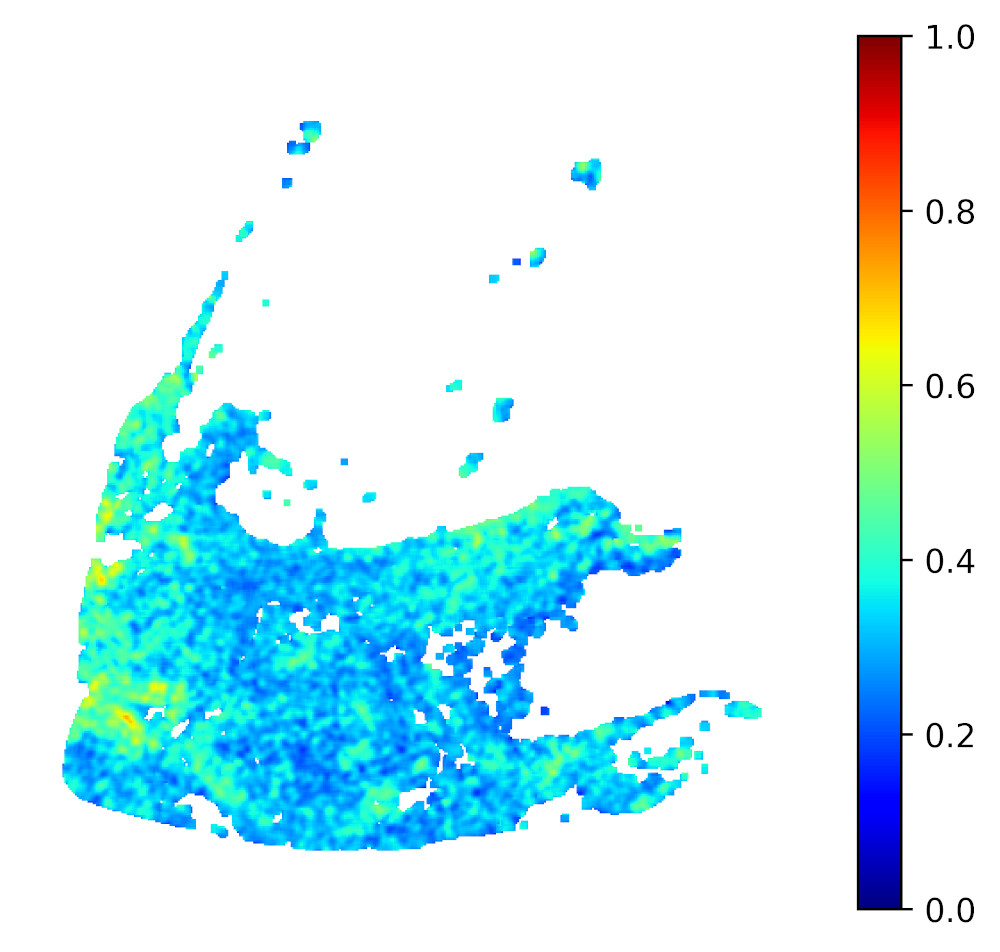
- save_colorbar_png(png_file, interpolation='none', dpi=300, draw_fn=None, draw_args=())
Save the heatmap as a PNG image with color bar.
- Parameters:
png_file (str) – File name or path for saving the PNG file.
interpolation (str, default="none") – An interpolation method used internally by matplotlib.pyplot.imshow
dpi (int, default=300) – Saved image resolution in dots per inch.
draw_fn (function, optional) – Custom function to draw on the heatmap image canvas.
draw_args (tuple, optional) – Arguments for the custom draw function.
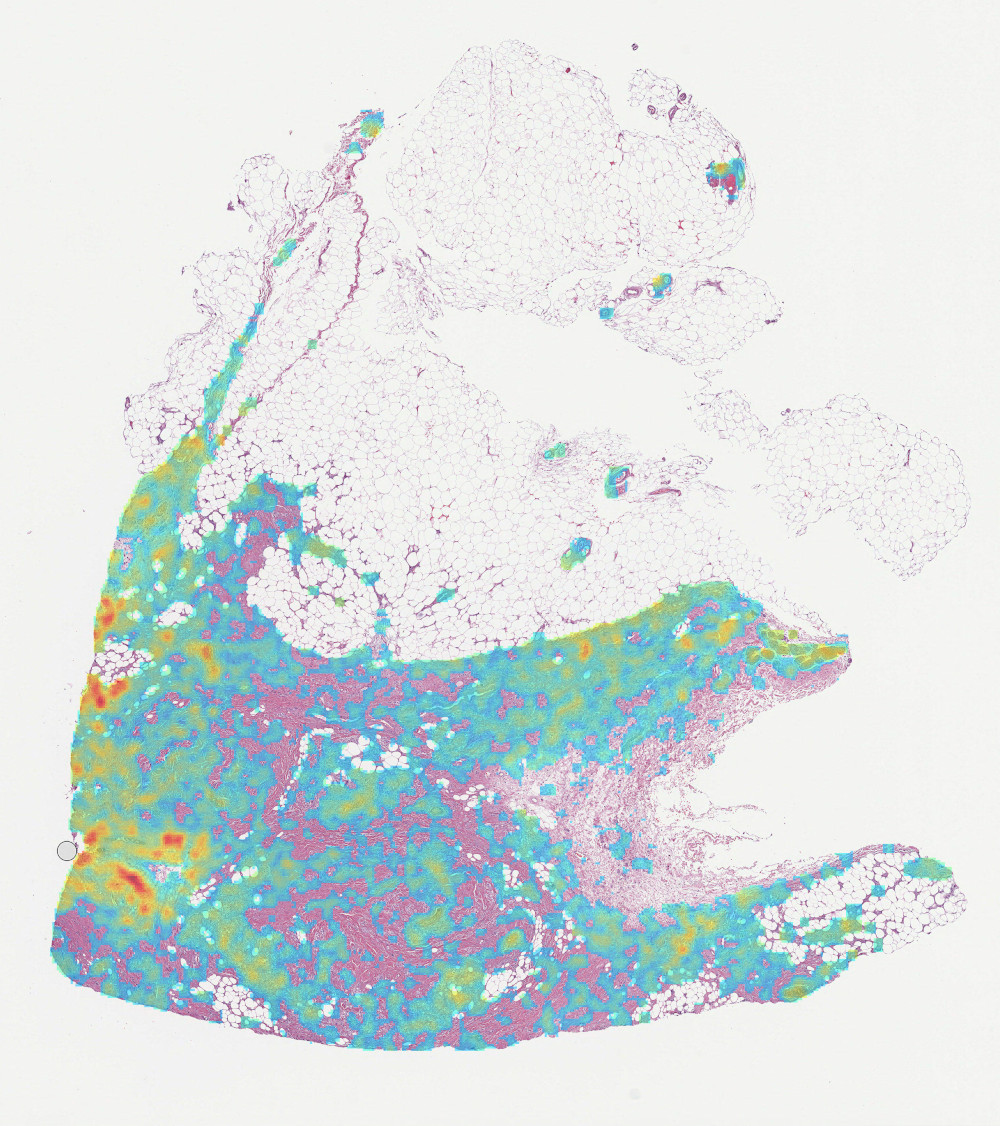
- save_overlay_png(png_file, wsi_file, cutoff=None, draw_fn=None, draw_args=())
Save the heatmap as a PNG tissue overlay image.
Background color value will be ignored.
- Parameters:
png_file (str) – File name or path for saving the PNG file.
wsi_file (str) – Name or path to a WSI file that the heatmap is generated for.
cutoff (float, optional) – Heatmap data values below the cutoff value will be ignored. This allows for the elimination of low probability values.
draw_fn (function, optional) – Custom function to draw on the heatmap image canvas.
draw_args (tuple, optional) – Arguments for the custom draw function.
- save_png(png_file, draw_fn=None, draw_args=())
Save the heatmap as a PNG image.
- Parameters:
png_file (str) – File name or path for saving the PNG file.
draw_fn (function, optional) – Custom function to draw on the heatmap image canvas.
draw_args (tuple, optional) – Arguments for the custom draw function.
- save_tif(tif_file, wsi_file, downsample_factor=None, allow_compression=True, draw_fn=None, draw_args=())
Save the heatmap as a TIF image with embedded resolution information.
- Parameters:
tif_file (str) – File name or path for saving the TIF file.
wsi_file (str) – Name or path to a WSI file that the heatmap is generated for.
downsample_factor (float, optional) – Downsample factor used for resolution information. If not provided, the value will be determined based on the heatmap data size.
allow_compression (bool, default: True) – If True, JPEG compression will be applied automatically when transparency is not used and when the image background is defined.
draw_fn (function, optional) – Custom function to draw on the heatmap image canvas.
draw_args (tuple, optional) – Arguments for the custom draw function.
Note
Technically it is possible to feed any input data into the WSIHeatmap class. Such data needs to be a
two-dimensional NumPy array with one restriction: values representing background pixels (i.e. pixels not processed
by the model) should be encoded as NumPy nan (not a number) values.
Warning
When generating heatmaps for a larger collection of images in one experiment, a data range should be specified
(using vmin and vmax), otherwise the same color will represent different values for different images.
Examples
Custom drawing
Custom drawing is implemented by passing two additional parameters (draw_fn and draw_args) to all image saving
functions. However the implementation details are not the same for each saving function. Assuming the variable
inference represents a WSIInference object, the following example will add a custom label to the image saved
using save_png:
from PIL import ImageFont
from dplabtools.slides.processing import WSIHeatmap
def draw_function(drawing_conext, *args):
x, y, label, size = args
font_path = "/tmp/DejaVuSans.ttf"
font = ImageFont.truetype(font_path, size)
drawing_conext.text((x, y), label, font=font, fill=(0,0,0))
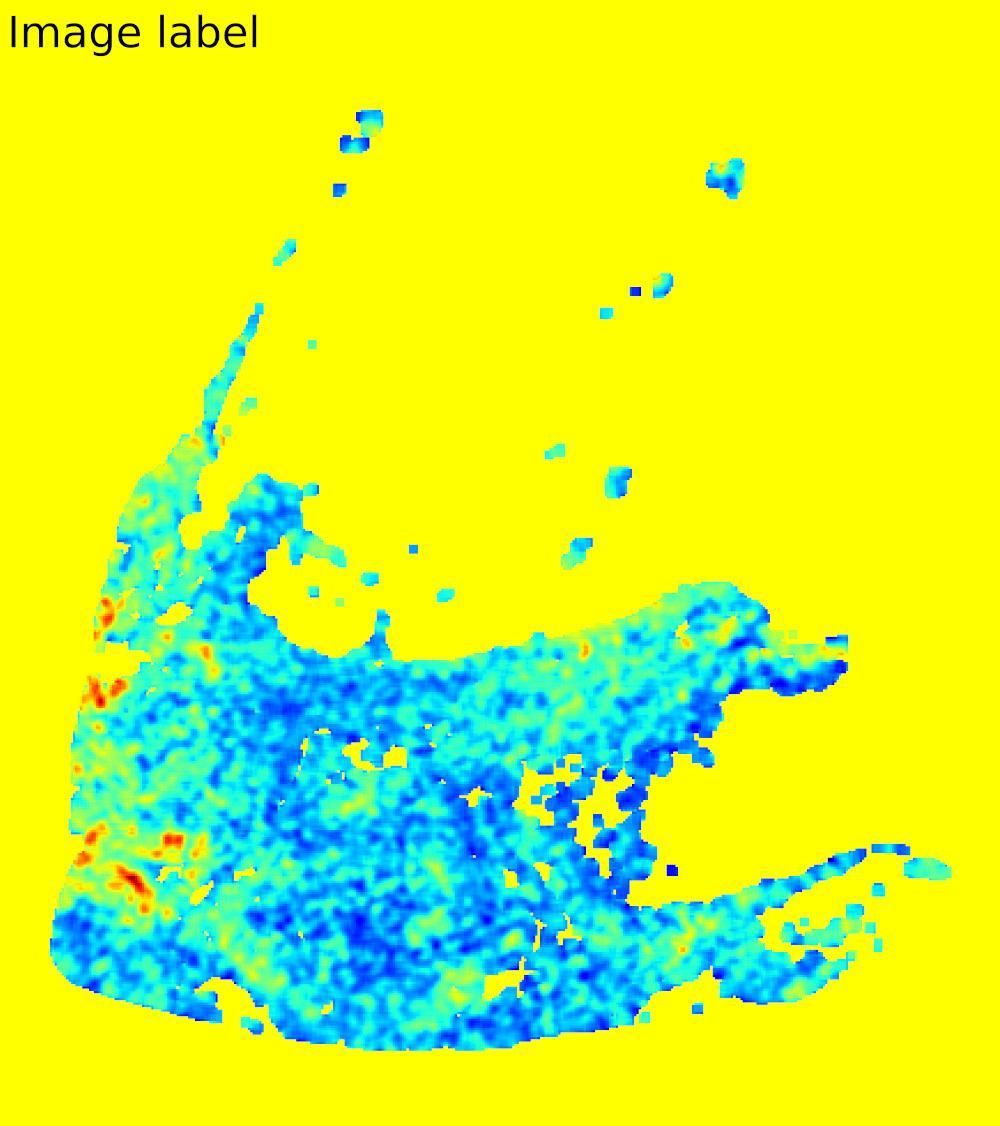
heatmap = WSIHeatmap(heatmap_data=inference.classes_array[0], alpha=1, background_color="yellow")
heatmap.save_png("heatmap6.png", draw_fn=draw_function, draw_args=(50, 50, "Image label", 300))
Output: