Patch locations/sampling
dplaptools provides a set of classes for calculating patch locations on the inside and outside of annotated
regions (represented by polygons) or whole images. Patch sampling methods include: random patches, grid patches and
Poisson disk patches. Additionally, using externally computed patch locations is also possible by utilizing classes
dedicated to custom patches.
Objects created from classes introduced below can be fed directly into Patch Extraction classes for patch extraction, or be processed independently using embedded properties.
Other class features:
Built-in counters with calculated patch information.
Generating preview images with calculated patches.
Additional features for annotated WSIs:
Configurable handling of embedded polygons.
Built-in checks and warnings for overlapping polygons.
Filtering polygons based on arbitrary label values.
Ability to apply different processing parameters to polygons with different labels.
Random patches on whole images
- class dplabtools.slides.patches.WholeImageRandomPatches(...)
Class for calculating patch locations on whole images using random sampling.
Basic usage
from dplabtools.slides.patches import WholeImageRandomPatches

wsi_file = "/tmp/wsi1.svs"
mask_file = "/tmp/wsi1_mask.png"

random_patches = WholeImageRandomPatches(
    wsi_file=wsi_file,
    mask_data=mask_file,
    patch_size=500,
    num_patches=20,
)
random_patches.save_preview_image("patches_image_random.jpg")
Output (patches_image_random.jpg):

Class details
Parameters specific to WholeImageRandomPatches:
- class dplabtoolshiddenclass_a30d0ab7b68a4008aa6d17819ed56d63
- Parameters:
num_patches (int) – Number of patch locations to calculate.
weak_label (str, optional) – Label assigned to all calculated patches.
Poisson disk patches on whole images
- class dplabtools.slides.patches.WholeImagePoissonDiskPatches(...)
Class for calculating patch locations on whole images using Poisson disk sampling.
Basic usage
from dplabtools.slides.patches import WholeImagePoissonDiskPatches

wsi_file = "/tmp/wsi1.svs"
mask_file = "/tmp/wsi1_mask.png"

poisson_patches = WholeImagePoissonDiskPatches(
    wsi_file=wsi_file,
    mask_data=mask_file,
    patch_size=500,
    poisson_spacing=60,
)
poisson_patches.save_preview_image("patches_image_poisson.jpg")
Output (patches_image_poisson.jpg)
Class details
Parameters specific to WholeImagePoissonDiskPatches:
- class dplabtoolshiddenclass_b3af069d1840447fb9e5d456dd9cb9a9
- Parameters:
poisson_spacing (int, default=50) – Spacing between calculated patches, the optimal value should be determined experimentally.
weak_label (str, optional) – Label assigned to all calculated patches.
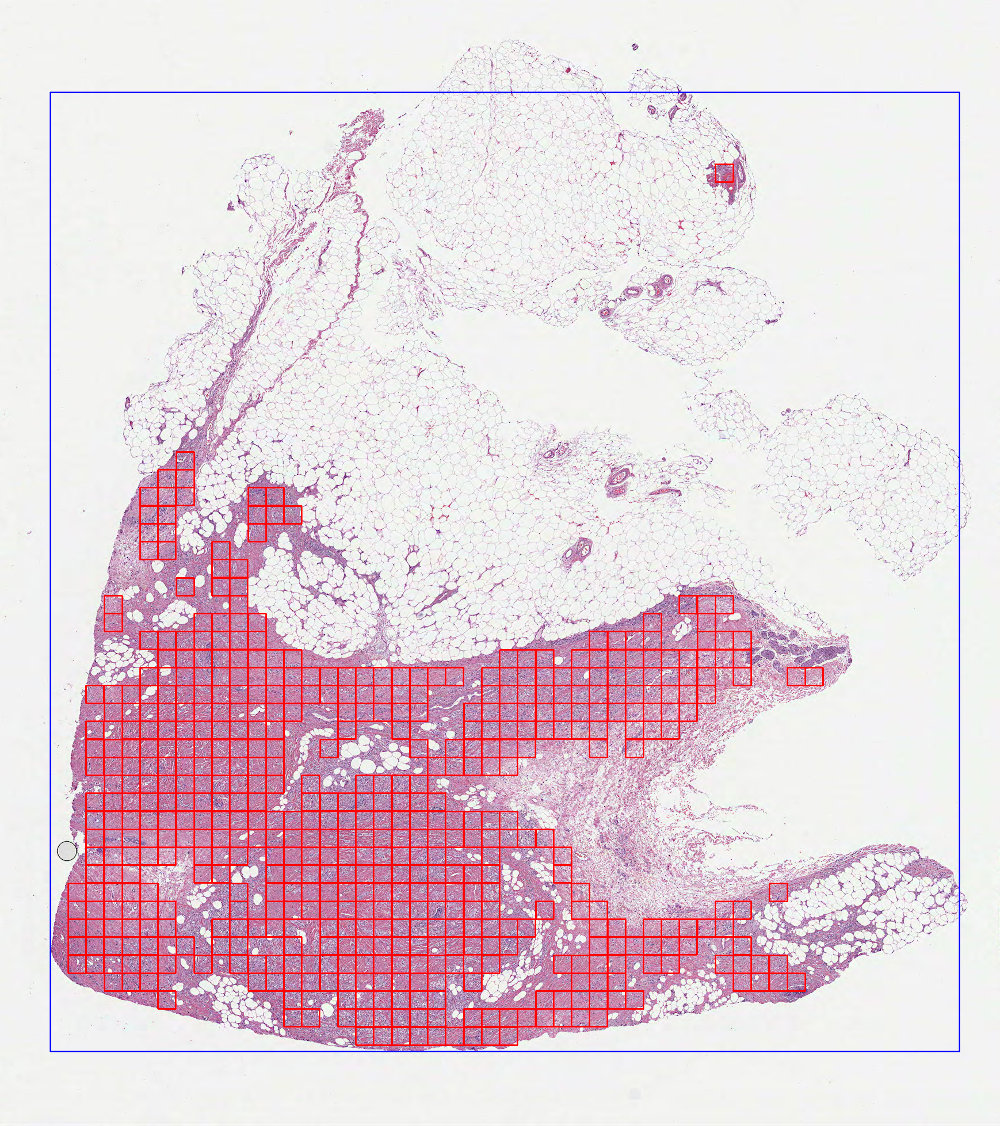
Grid based patches on whole images
- class dplabtools.slides.patches.WholeImageGridPatches(...)
Class for calculating patch locations on whole images using grid based sampling.
Basic usage
from dplabtools.slides.patches import WholeImageGridPatches

wsi_file = "/tmp/wsi1.svs"
mask_file = "/tmp/wsi1_mask.png"

grid_patches = WholeImageGridPatches(
    wsi_file=wsi_file,
    mask_data=mask_file,
    patch_size=500,
    patch_stride=1,
)
grid_patches.save_preview_image("patches_image_grid.jpg")
Output (patches_image_grid.jpg):
Class details
Parameters specific to WholeImageGridPatches:
- class dplabtoolshiddenclass_b8efff2164324456a6ad2d3786f019dc
- Parameters:
patch_stride (int or float, default=1) – A measurement of overlap between grid patches.
weak_label (str, optional) – Label assigned to all calculated patches.
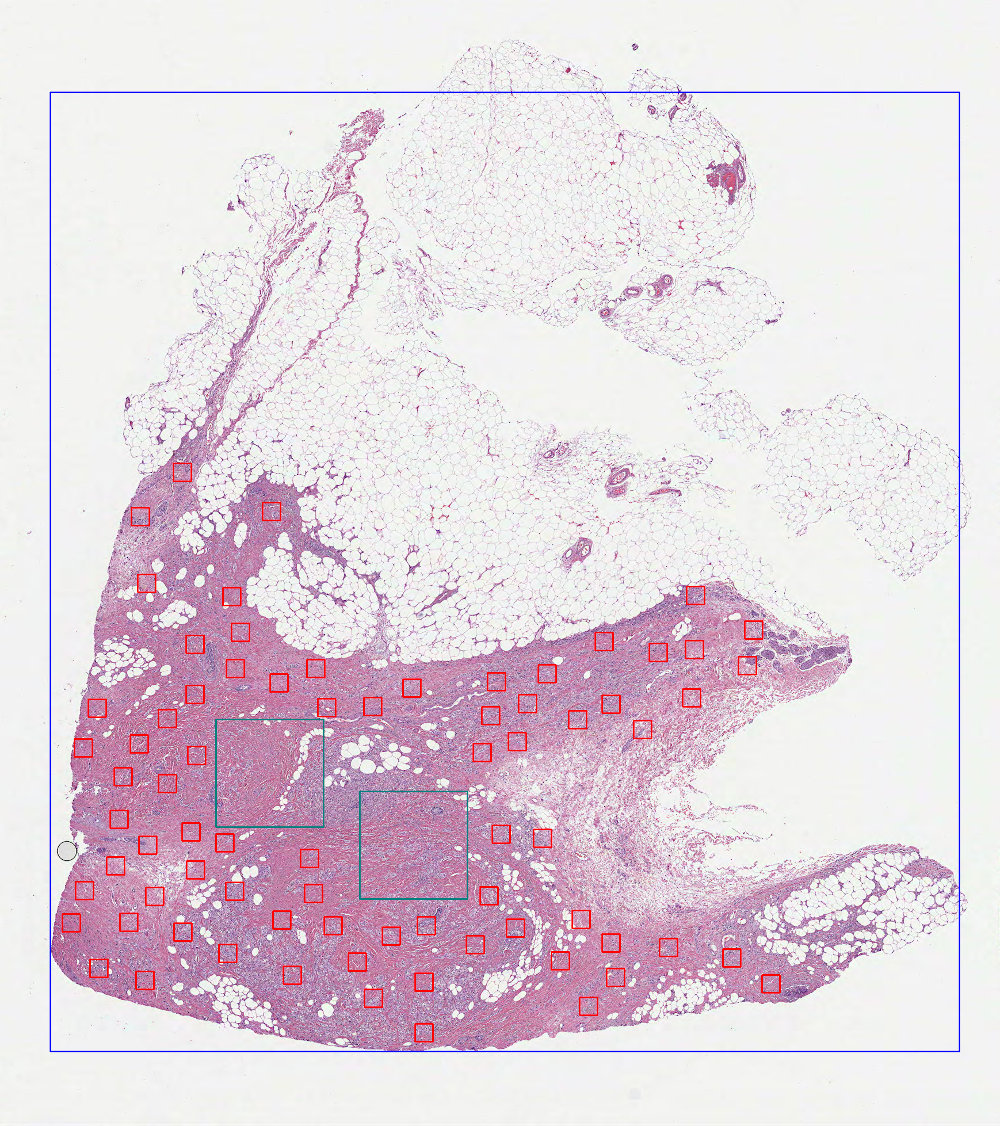
Inverted random patches on whole images
- class dplabtools.slides.patches.WholeImageInvertedRandomPatches(...)
Class for calculating patch locations on whole images with excluded polygon regions using random sampling.
Basic usage
from dplabtools.slides.patches import WholeImageInvertedRandomPatches
from dplabtools.slides.utils import AnnotationPolygon

wsi_file = "/tmp/wsi1.svs"
mask_file = "/tmp/wsi1_mask.png"

poly1 = AnnotationPolygon(
    points=[(10000, 22000), (10000, 25000), (13000, 25000), (13000, 22000)], label=""
)
poly2 = AnnotationPolygon(
    points=[(6000, 20000), (6000, 23000), (9000, 23000), (9000, 20000)], label=""
)
polygon_data = [poly1, poly2]

random_patches = WholeImageInvertedRandomPatches(
    wsi_file=wsi_file,
    mask_data=mask_file,
    patch_size=500,
    num_patches=50,
    polygon_data=polygon_data,
)
random_patches.save_preview_image("patches_image_inverted_random.jpg")
Output (patches_image_inverted_random.jpg):

Class details
Parameters specific to WholeImageInvertedRandomPatches:
- class dplabtoolshiddenclass_c0ee57a5d4184863a1c9398083874e06
- Parameters:
num_patches (int) – Number of patch locations to calculate.
polygon_data (list of AnnotationPolygon objects or JSON file/string with serialized AnnotationPolygon objects) – Polygons representing excluded regions.
weak_label (str, optional) – Label assigned to all calculated patches.
included_labels (list of str, optional) – Polygon labels included in calculations, all other labels will be ignored.
excluded_labels (list of str, optional) – Polygon labels excluded from calculations.
Inverted Poisson disk patches on whole images
- class dplabtools.slides.patches.WholeImageInvertedPoissonDiskPatches(...)
Class for calculating patch locations on whole images with excluded polygon regions using Poisson disk sampling.
Basic usage
from dplabtools.slides.patches import WholeImageInvertedPoissonDiskPatches
from dplabtools.slides.utils import AnnotationPolygon

wsi_file = "/tmp/wsi1.svs"
mask_file = "/tmp/wsi1_mask.png"

poly1 = AnnotationPolygon(
    points=[(10000, 22000), (10000, 25000), (13000, 25000), (13000, 22000)], label=""
)
poly2 = AnnotationPolygon(
    points=[(6000, 20000), (6000, 23000), (9000, 23000), (9000, 20000)], label=""
)
polygon_data = [poly1, poly2]

poisson_patches = WholeImageInvertedPoissonDiskPatches(
    wsi_file=wsi_file,
    mask_data=mask_file,
    patch_size=500,
    poisson_spacing=60,
    polygon_data=polygon_data,
)
poisson_patches.save_preview_image("patches_image_inverted_poisson.jpg")
Output (patches_image_inverted_poisson.jpg):
Class details
Parameters specific to WholeImageInvertedPoissonDiskPatches:
- class dplabtoolshiddenclass_00161225c17044e9b575df99b9c8adae
- Parameters:
poisson_spacing (int, default=50) – Spacing between calculated patches, the optimal value should be determined experimentally.
polygon_data (list of AnnotationPolygon objects or JSON file/string with serialized AnnotationPolygon objects) – Polygons representing excluded regions.
weak_label (str, optional) – Label assigned to all calculated patches.
included_labels (list of str, optional) – Polygon labels included in calculations, all other labels will be ignored.
excluded_labels (list of str, optional) – Polygon labels excluded from calculations.
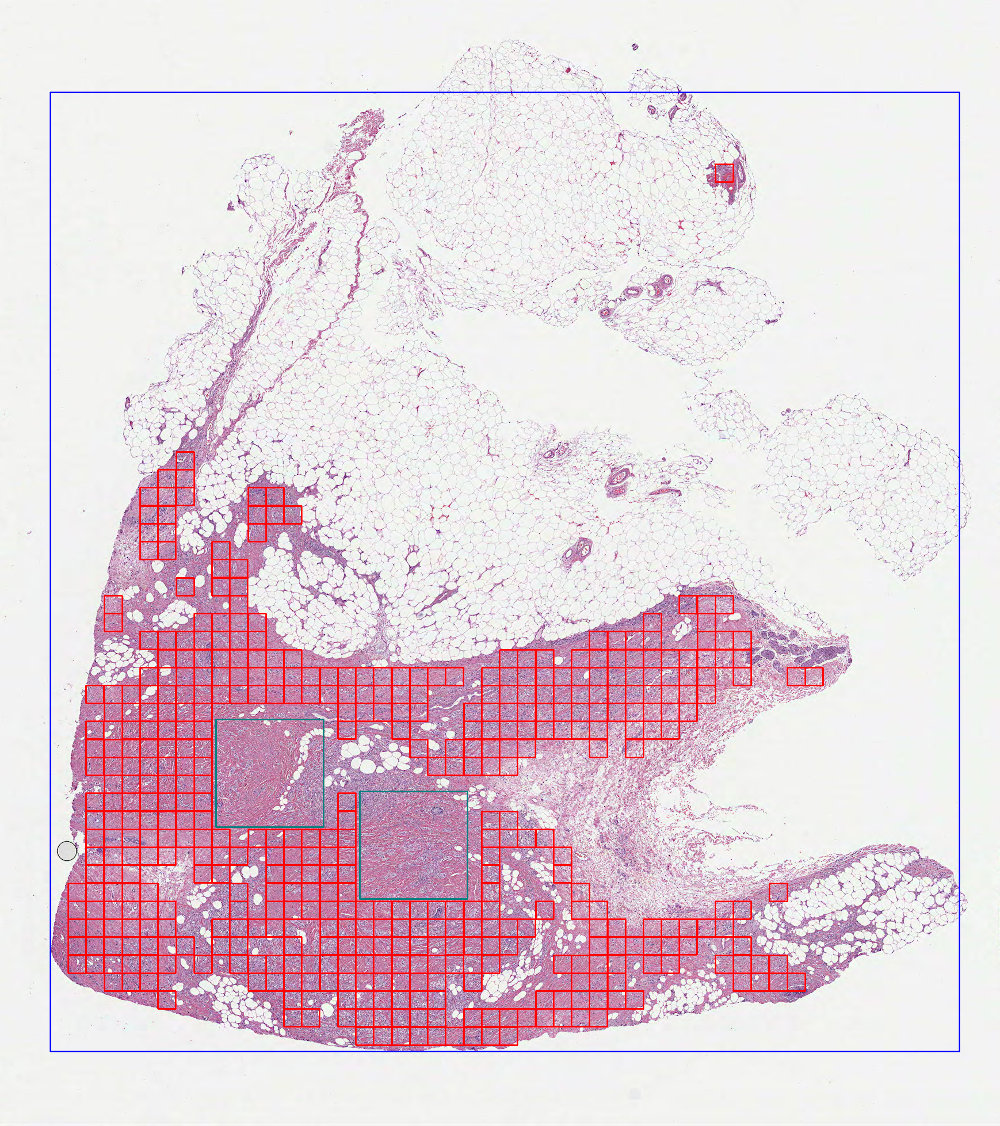
Inverted grid based patches on whole images
- class dplabtools.slides.patches.WholeImageInvertedGridPatches(...)
Class for calculating patch locations on whole images with excluded polygon regions using grid based sampling.
Basic usage
from dplabtools.slides.patches import WholeImageInvertedGridPatches
from dplabtools.slides.utils import AnnotationPolygon

wsi_file = "/tmp/wsi1.svs"
mask_file = "/tmp/wsi1_mask.png"

poly1 = AnnotationPolygon(
    points=[(10000, 22000), (10000, 25000), (13000, 25000), (13000, 22000)], label=""
)
poly2 = AnnotationPolygon(
    points=[(6000, 20000), (6000, 23000), (9000, 23000), (9000, 20000)], label=""
)
polygon_data = [poly1, poly2]

grid_patches = WholeImageInvertedGridPatches(
    wsi_file=wsi_file,
    mask_data=mask_file,
    patch_size=500,
    patch_stride=1,
    polygon_data=polygon_data,
)
grid_patches.save_preview_image("patches_image_inverted_grid.jpg")
Output (patches_image_inverted_grid.jpg):
Class details
Parameters specific to WholeImageInvertedGridPatches:
- class dplabtoolshiddenclass_24406c89fa2b4476a460d0358b7b26bc
- Parameters:
patch_stride (int or float, default=1) – A measurement of overlap between grid patches.
polygon_data (list of AnnotationPolygon objects or JSON file/string with serialized AnnotationPolygon objects) – Polygons representing excluded regions.
weak_label (str, optional) – Label assigned to all calculated patches.
included_labels (list of str, optional) – Polygon labels included in calculations, all other labels will be ignored.
excluded_labels (list of str, optional) – Polygon labels excluded from calculations.
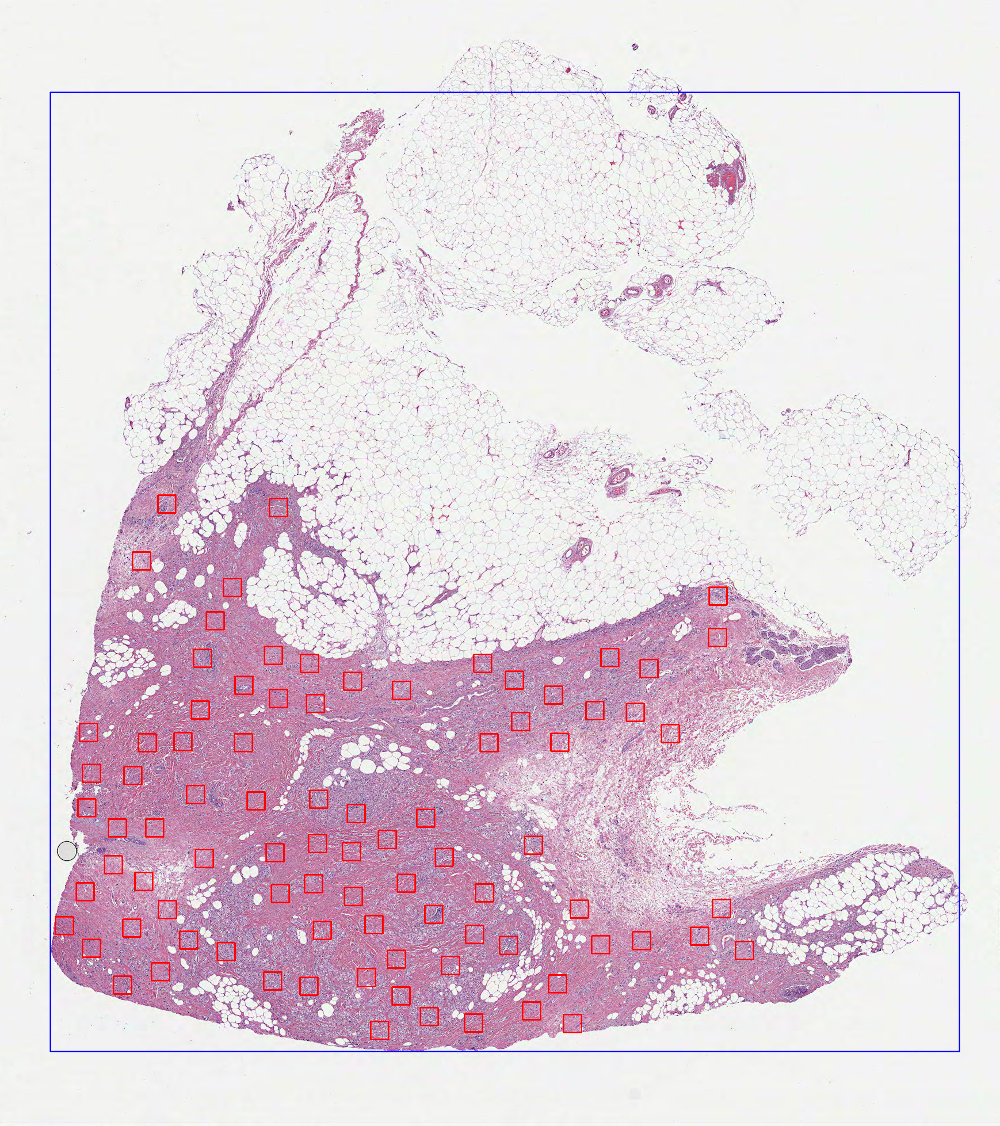
Random patches on polygon regions
- class dplabtools.slides.patches.PolygonRegionRandomPatches(...)
Class for calculating patch locations from polygon regions using random sampling.
Basic usage
from dplabtools.slides.patches import PolygonRegionRandomPatches
from dplabtools.slides.utils import AnnotationPolygon
wsi_file = "/tmp/wsi1.svs"
mask_file = "/tmp/wsi1_mask.png"
poly1 = AnnotationPolygon(
points=[(10000, 22000), (10000, 25000), (13000, 25000), (13000, 22000)], label=""
)
poly2 = AnnotationPolygon(
points=[(6000, 20000), (6000, 23000), (9000, 23000), (9000, 20000)], label=""
)
polygon_data = [poly1, poly2]
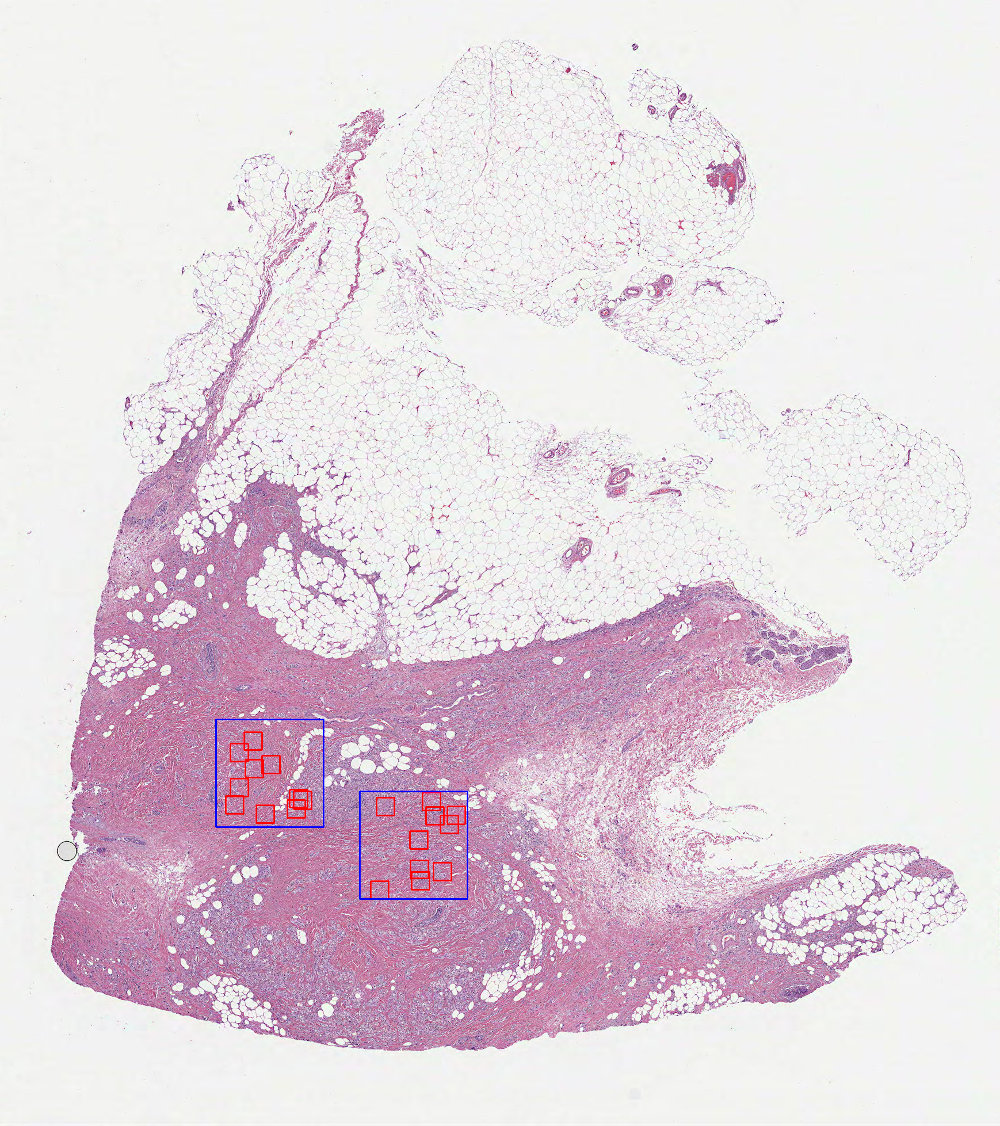
random_patches = PolygonRegionRandomPatches(
wsi_file=wsi_file,
mask_data=mask_file,
patch_size=500,
num_patches=10,
polygon_data=polygon_data,
)
random_patches.save_preview_image("patches_polygons_random.jpg")
Output (patches_polygons_random.jpg):
Class details
Parameters specific to PolygonRegionRandomPatches:
- class dplabtoolshiddenclass_e7862fb1600e46baaddaf01291c6fbe7
- Parameters:
num_patches (int) – Number of patch locations to calculate.
polygon_data (list of AnnotationPolygon objects or JSON file/string with serialized AnnotationPolygon objects) – Polygons representing regions of interest.
check_polygons (bool, default=True) – Enables checking for overlapping polygons and polygons contained in other polygons.
included_labels (list of str, optional) – Polygon labels included in calculations, all other labels will be ignored.
excluded_labels (list of str, optional) – Polygon labels excluded from calculations.
Note
In this class, parameter num_patches denotes the number of patches per one polygon region. This behavior
can be changed using Expandable parameters.
See also
See also
Poisson disk patches on polygon regions
- class dplabtools.slides.patches.PolygonRegionPoissonDiskPatches(...)
Class for calculating patch locations from polygon regions using Poisson disk sampling.
Basic usage
from dplabtools.slides.patches import PolygonRegionPoissonDiskPatches
from dplabtools.slides.utils import AnnotationPolygon

wsi_file = "/tmp/wsi1.svs"
mask_file = "/tmp/wsi1_mask.png"

poly1 = AnnotationPolygon(
    points=[(10000, 22000), (10000, 25000), (13000, 25000), (13000, 22000)], label=""
)
poly2 = AnnotationPolygon(
    points=[(6000, 20000), (6000, 23000), (9000, 23000), (9000, 20000)], label=""
)
polygon_data = [poly1, poly2]

poisson_patches = PolygonRegionPoissonDiskPatches(
    wsi_file=wsi_file,
    mask_data=mask_file,
    patch_size=500,
    poisson_spacing=40,
    polygon_data=polygon_data,
)
poisson_patches.save_preview_image("patches_polygons_poisson.jpg")
Output (patches_polygons_poisson.jpg):

Class details
Parameters specific to PolygonRegionPoissonDiskPatches:
- class dplabtoolshiddenclass_3e6d3dd56317427fbfabb178de04846a
- Parameters:
poisson_spacing (int, default=50) – Spacing between calculated patches, the optimal value should be determined experimentally.
polygon_data (list of AnnotationPolygon objects or JSON file/string with serialized AnnotationPolygon objects) – Polygons representing regions of interest.
check_polygons (bool, default=True) – Enables checking for overlapping polygons and polygons contained in other polygons.
included_labels (list of str, optional) – Polygon labels included in calculations, all other labels will be ignored.
excluded_labels (list of str, optional) – Polygon labels excluded from calculations.
See also
See also
Grid based patches on polygon regions
- class dplabtools.slides.patches.PolygonRegionGridPatches(...)
Class for calculating patch locations from polygon regions using grid based sampling.
Basic usage
from dplabtools.slides.patches import PolygonRegionGridPatches
from dplabtools.slides.utils import AnnotationPolygon
wsi_file = "/tmp/wsi1.svs"
mask_file = "/tmp/wsi1_mask.png"
poly1 = AnnotationPolygon(
points=[(10000, 22000), (10000, 25000), (13000, 25000), (13000, 22000)], label=""
)
poly2 = AnnotationPolygon(
points=[(6000, 20000), (6000, 23000), (9000, 23000), (9000, 20000)], label=""
)
polygon_data = [poly1, poly2]
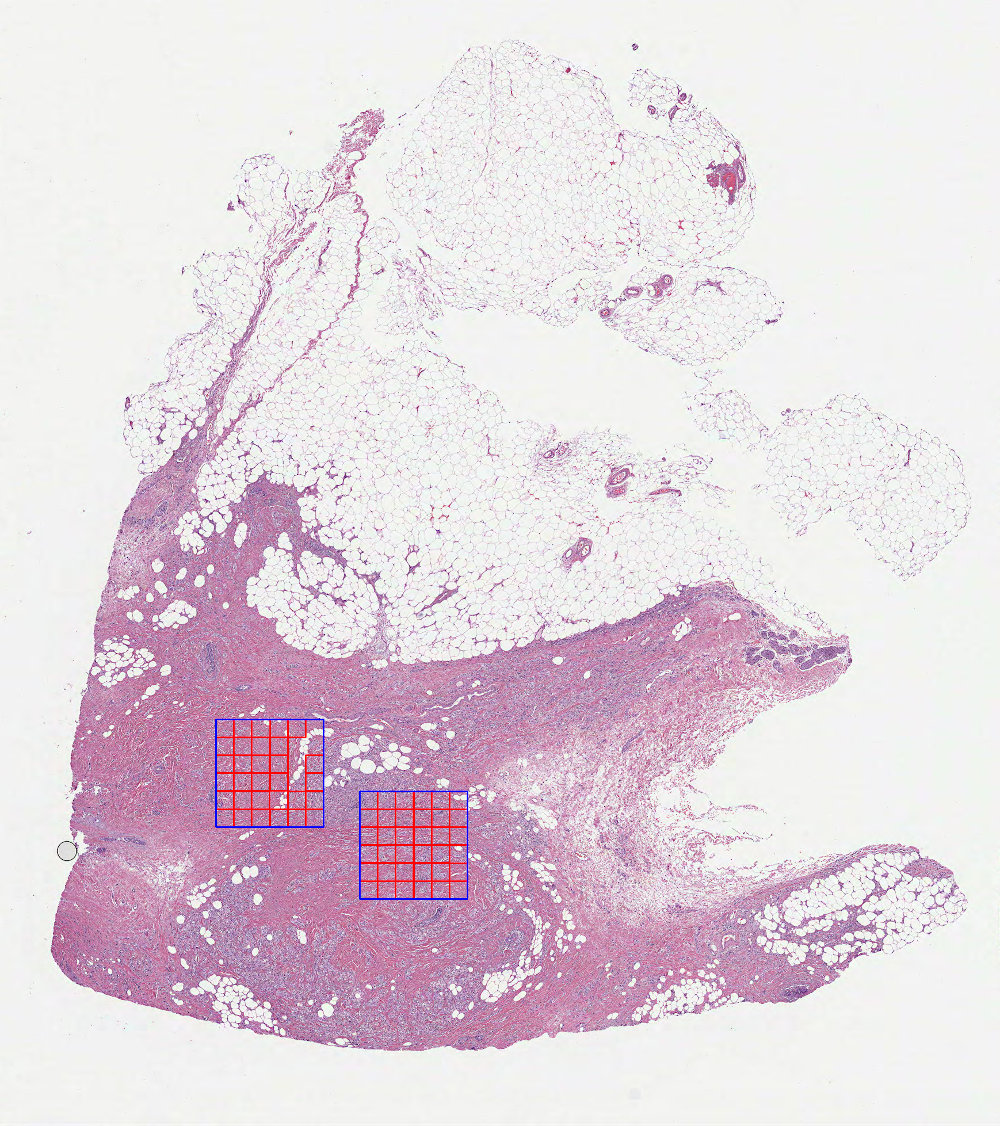
grid_patches = PolygonRegionGridPatches(
wsi_file=wsi_file,
mask_data=mask_file,
patch_size=500,
patch_stride=1,
polygon_data=polygon_data,
)
grid_patches.save_preview_image("patches_polygons_grid.jpg")
Output (patches_polygons_grid.jpg):
Class details
Parameters specific to PolygonRegionGridPatches:
- class dplabtoolshiddenclass_2739a5035da744578432914c31df5a6e
- Parameters:
patch_stride (int or float, default=1) – A measurement of overlap between grid patches.
polygon_data (list of AnnotationPolygon objects or JSON file/string with serialized AnnotationPolygon objects) – Polygons representing regions of interest.
check_polygons (bool, default=True) – Enables checking for overlapping polygons and polygons contained in other polygons.
included_labels (list of str, optional) – Polygon labels included in calculations, all other labels will be ignored.
excluded_labels (list of str, optional) – Polygon labels excluded from calculations.
See also
See also
Custom patches
The following classes allow the user to feed and process externally computed patch locations:
- class dplabtools.slides.patches.WholeImageCustomPatches(...)
Class for calculating patch locations on whole images using custom points.
- class dplabtools.slides.patches.WholeImageInvertedCustomPatches(...)
Class for calculating patch locations on whole images with excluded polygon regions using custom points.
- class dplabtools.slides.patches.PolygonRegionCustomPatches(...)
Class for calculating patch locations from polygon regions using custom points.
Example
from dplabtools.slides.patches import WholeImageCustomPatches

wsi_file = "/tmp/wsi1.svs"
mask_file = "/tmp/wsi1_mask.png"
points = [(3000, 3000), (4000, 4000), (5000, 5000), (6000, 6000)]

custom_patches = WholeImageCustomPatches(
    wsi_file=wsi_file,
    mask_data=mask_file,
    patch_size=500,
    points=points,
)
Class details
Parameters specific to all custom patches classes:
- class dplabtoolshiddenclass_b425e1835ddc4313a6f4bb13f9ae61a7
- Parameters:
points (list of tuples) – List of (x,y) int values representing points that are calculated using WSI level 0 coordinates. Points should represent the top-left corner of patches.
Note
It is worth noting that points provided by the user represent candidate patches, not the final patches.
Each point must satisfy other relevant criteria (foreground_ratio, overlap_ratio, etc.) to be considered
a valid (final) patch.
Parameters common in all patch classes
- class dplabtoolshiddenclass_b2faaf63a99f44ed94b05d9d5e356322
- Parameters:
wsi_file (str) – WSI file name or path.
mask_data (str or object) – Mask file name or path, NumPy array object, or Pillow image object.
patch_size (int, default=256) – Size of calculated patches.
level_or_mpp (int or float, default=0) – WSI level or MPP value of calculated patches.
foreground_ratio (float, default=0.95) – Minimum percentage of tissue in each calculated patch.
overlap_ratio (float, default=0.95) – Minimum percentage of overlap between each calculated patch and the image or polygon region.
polygon_buffer (int, default=0) – Additional buffer to increase or decrease the image or polygon region.
See also
See also
See also
Methods and properties common to all patch classes
Common methods and properties are derived from the base class.
- class dplabtools.slides.patches.locations.base.BasePatches(...)
Base class for whole image or polygon based patch locations computing.
- save_preview_image(image_file, patch_color='red', bbox_color='lime', polygon_color='blue', holes_color='teal', buffer_color='black', thickness=2, patch_markers=False, level_or_minsize=None, drawn_labels=[], drawn_patches_labels=[])
Save preview image presenting calculated patches and image/polygon boundaries.
Draw and save patch/polygon preview image based on mask size (default) or an arbitrary WSI level.
- Parameters:
image_file (str) – Image file name or path.
patch_color (str, default="red") – Color of drawn patches and patch markers.
bbox_color (str, default="lime") – Color of drawn polygon bounding boxes.
polygon_color (str, default="blue") – Color of drawn polygons.
holes_color (str, default="teal") – Color of drawn polygon holes.
buffer_color (str, default="black") – Color of drawn polygons after applying the buffer.
thickness (int, default=2) – Thickness of the drawing line.
patch_markers (bool, default=False) – Whether to draw patch markers or not.
level_or_minsize (int, optional) – Determines physical dimensions of the saved image. It’s either a WSI level or a minimal desired size in pixels.
drawn_labels (list of str, optional) – List of labels for drawing polygons, all other polygons will be ignored.
drawn_patches_labels (list of str, optional) – List of labels for drawing patches, all other patches will be ignored.
- property class_name
Return the name of the patches object class.
- property level_or_mpp
Return the level or MPP value used in patch calculations.
- property mask_shape
Return the shape of the used mask.
- property param_info
Return the parameter information used in patch calculations.
- property patch_count
Return the number of calculated patches.
- property patch_data
Return the patch data (location, size, label) for all calculated patches at level 0.
- property patch_data_mask_level
Return the patch data (location, size, label) for all calculated patches at the mask level.
- property patch_info
Return the patch information (counts and labels) for all calculated patches.
- property patch_labels
Return the distinct polygon labels used in patch calculations.
- property patch_size
Return the provided patch size.
- property polygon_labels
Return all polygon labels used in patch calculations.
- property shapely_polygons
Return the Shapely polygon objects representing polygons in patch calculations.
- property wsi_file
Return the provided WSI file name.
- property wsi_slide
Return the WSI slide object created during patch calculations.
See also
See also
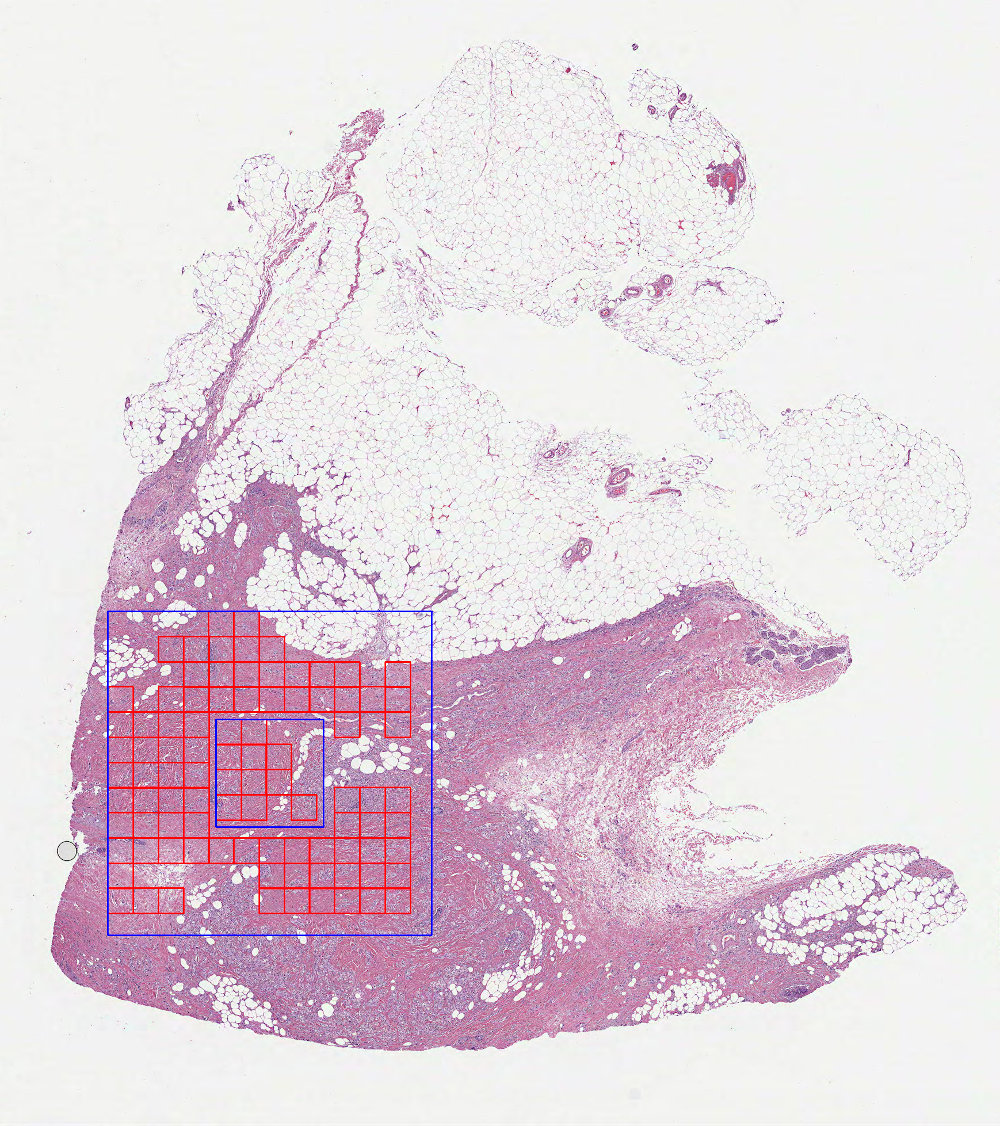
“check_polygons” explained
Parameter check_polygons controls how overlapping and contained (embedded) polygons are handled.
Case 1 (
check_polygons=False)
In this mode each polygon is treated as an independent entity, which will cause certain regions to be sampled more than once:

Case 2 (
check_polygons=True- default value)
In this mode mutual relationships between polygons are taken into account and polygon transformations are applied to prevent embedded regions from being sampled more than once:
Additionally, in this mode a warning message will be logged in case of partially overlapping polygons found:
wsi1.svs: Polygon 1 overlaps with polygon 2, overlapping area: 33.428571 patches
Parameters details
mask_data
WSI mask represented by an image file, numpy array file, or a numpy memory object. The dimensions of the mask should match one of the WSI levels.
patch_size
Patches are calculated as squares with dimensions
patch_sizexpatch_size.
level_or_mpp
Provided int number will be interpreted as a WSI level, while float value will be interpreted as an MPP value.
foreground_ratio
Minimum percentage of foreground tissue to be present in calculated patches (based on the
mask_data). The higher theforeground_ratiovalue, the more tissue-only area will be covered by calculated patches. Comparison of three differentforeground_ratiovalues (0.5, 0.8, 0.95):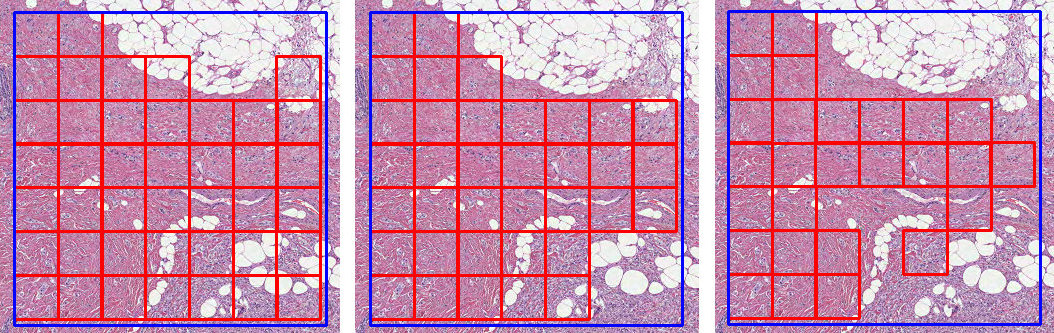
overlap_ratio
Minimum percentage of overlap between calculated patches and the image or polygon region. The higher the
overlap_ratiovalue, the more “contained” calculated patches will become. Comparison of three differentoverlap_ratiovalues (0.1, 0.5, 0.95):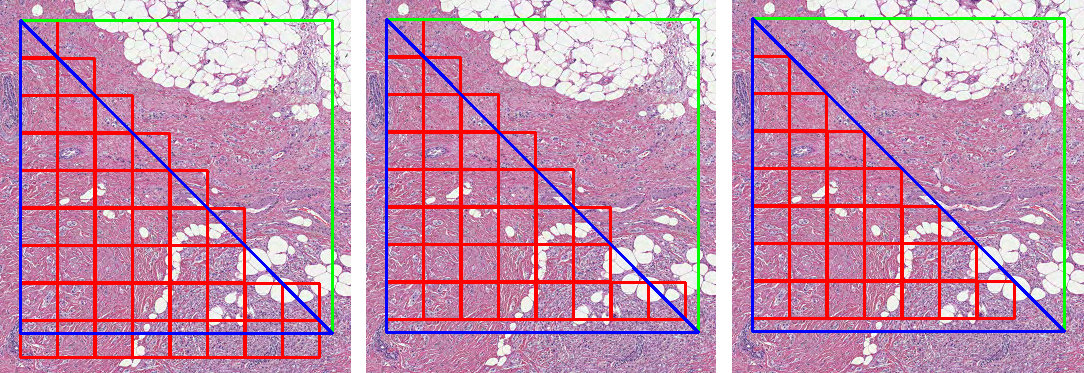
polygon_buffer
Non-zero value will either increase (positive
polygon_buffervalue) or decrease (negativepolygon_buffervalue) the area of the image or polygon region, thus changing the number of calculated patches. Comparison of three differentpolygon_buffervalues (0, 30, -30):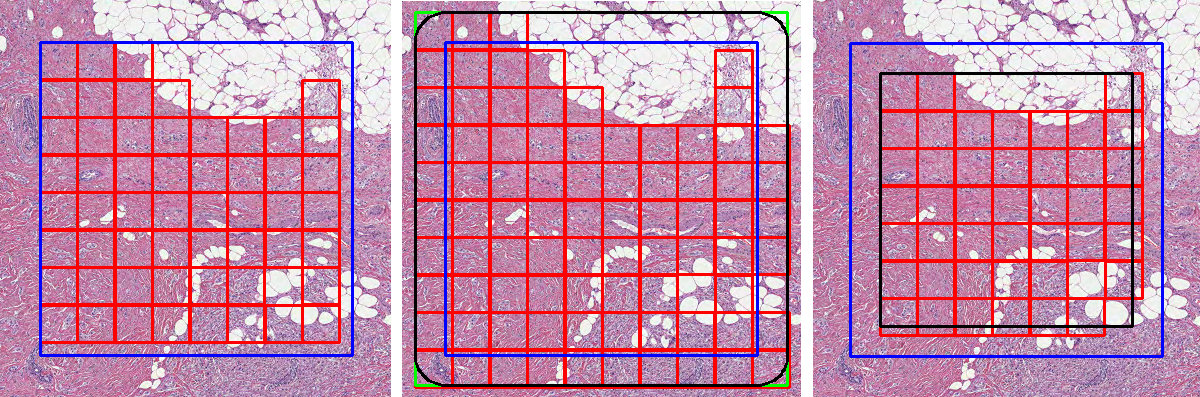
Expandable parameters
The following list defines so called “expandable parameters”, which means they can accept either a single value or a list of values:
num_patchespatch_stridepoisson_spacingforeground_ratiooverlap_ratiopolygon_buffer
This behavior is possible when using one of the polygon based classes:
PolygonRegionRandomPatchesPolygonRegionPoissonDiskPatchesPolygonRegionGridPatches
The size (len) of the expanded list should match the number of polygons present. Expanded parameters will be applied to corresponding polygons based on their position in the list.
Example 1 (num_patches=5 i.e. parameter is not expanded):
from dplabtools.slides.patches import PolygonRegionRandomPatches
from dplabtools.slides.utils import AnnotationPolygon

wsi_file = "/tmp/wsi1.svs"
mask_file = "/tmp/wsi1_mask.png"

poly1 = AnnotationPolygon(
    points=[(10000, 22000), (10000, 25000), (13000, 25000), (13000, 22000)], label="poly"
)
poly2 = AnnotationPolygon(
    points=[(6000, 20000), (6000, 23000), (9000, 23000), (9000, 20000)], label="poly"
)
poly3 = AnnotationPolygon(
    points=[(13000, 18000), (13000, 21000), (16000, 21000), (16000, 18000)], label="poly"
)
polygon_data = [poly1, poly2, poly3]

random_patches = PolygonRegionRandomPatches(
    wsi_file=wsi_file,
    mask_data=mask_file,
    patch_size=500,
    num_patches=5,
    polygon_data=polygon_data,
)
random_patches.save_preview_image("patches_polygons_not_expanded.jpg")
Output (patches_polygons_not_expanded.jpg):

Example 2 (num_patches=[1, 2, 3] i.e. parameter is expanded):
from dplabtools.slides.patches import PolygonRegionRandomPatches
from dplabtools.slides.utils import AnnotationPolygon

wsi_file = "/tmp/wsi1.svs"
mask_file = "/tmp/wsi1_mask.png"

poly1 = AnnotationPolygon(
    points=[(10000, 22000), (10000, 25000), (13000, 25000), (13000, 22000)], label="poly"
)
poly2 = AnnotationPolygon(
    points=[(6000, 20000), (6000, 23000), (9000, 23000), (9000, 20000)], label="poly"
)
poly3 = AnnotationPolygon(
    points=[(13000, 18000), (13000, 21000), (16000, 21000), (16000, 18000)], label="poly"
)
polygon_data = [poly1, poly2, poly3]

random_patches = PolygonRegionRandomPatches(
    wsi_file=wsi_file,
    mask_data=mask_file,
    patch_size=500,
    num_patches=[1, 2, 3],
    polygon_data=polygon_data,
)
random_patches.save_preview_image("patches_polygons_expanded.jpg")
Output (patches_polygons_expanded.jpg):
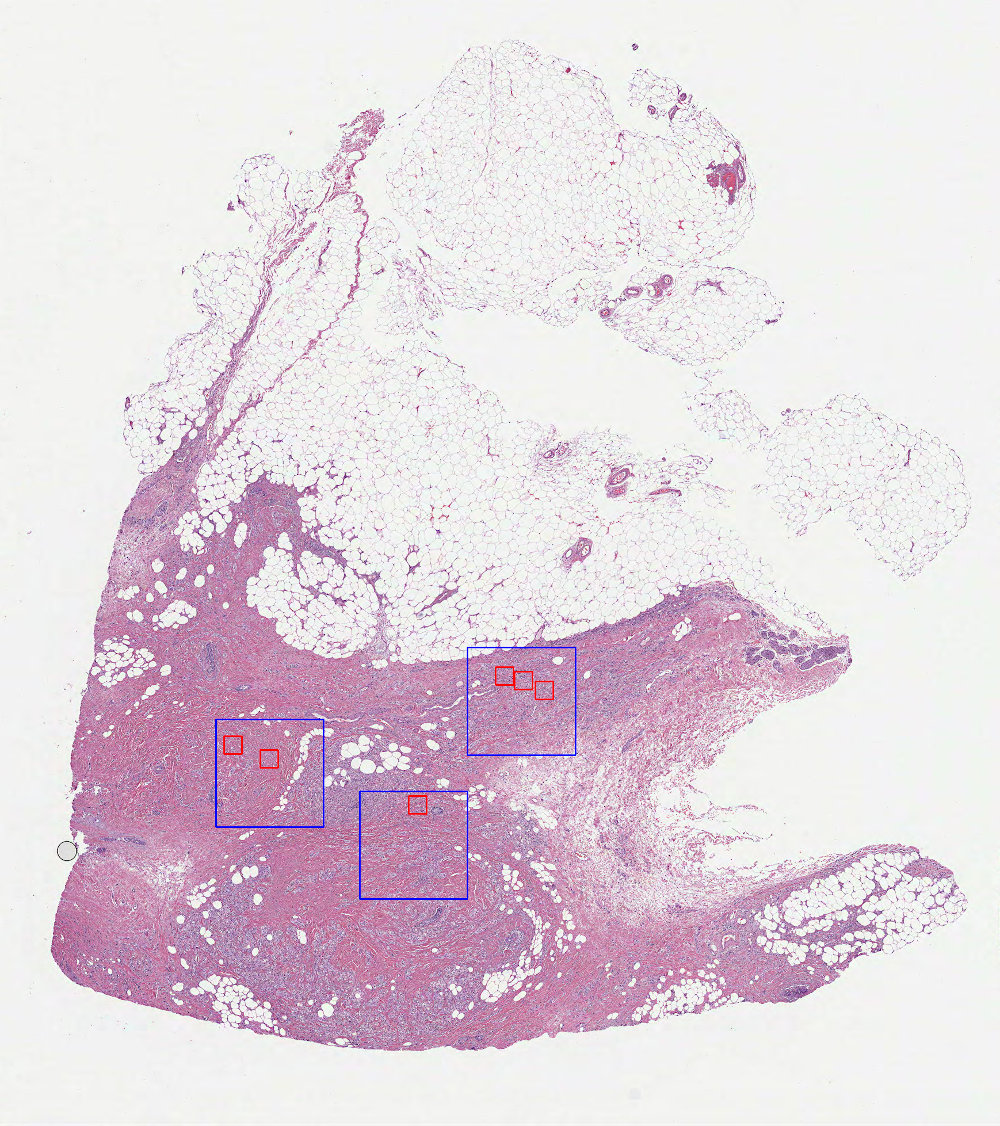
The same principle applies to all expandable parameters. Using a simple utility function, it is possible to automatically differentiate between different polygon labels, such as in the example below.
Example 3 (different patch_stride values applied to different polygon labels):
from dplabtools.slides.patches import PolygonRegionGridPatches
from dplabtools.slides.utils import AnnotationPolygon

wsi_file = "/tmp/wsi1.svs"
mask_file = "/tmp/wsi1_mask.png"

poly1 = AnnotationPolygon(
    points=[(10000, 22000), (10000, 25000), (13000, 25000), (13000, 22000)], label="rect"
)
poly2 = AnnotationPolygon(
    points=[(6000, 20000), (6000, 23000), (9000, 23000), (9000, 20000)], label="rect"
)
poly3 = AnnotationPolygon(
    points=[(13000, 18000), (13000, 21000), (16000, 21000)], label="triangle"
)
poly4 = AnnotationPolygon(
    points=[(6000, 24000), (6000, 27000), (9000, 27000)], label="triangle"
)
polygon_data = [poly1, poly2, poly3, poly4]

def get_stride_list(polygons, rect_stride=0.5, triangle_stride=1):
    return [rect_stride if poly.label == "rect" else triangle_stride for poly in polygons]

grid_patches = PolygonRegionGridPatches(
    wsi_file=wsi_file,
    mask_data=mask_file,
    patch_size=500,
    patch_stride=get_stride_list(polygon_data),
    polygon_data=polygon_data,
)
grid_patches.save_preview_image("patches_polygons_expanded_stride.jpg")
Output (patches_polygons_expanded_stride.jpg):

Preview image
By calling save_preview_image, calculated patches can be visualized and saved as a WSI overlay. The following
elements are included in the preview images, the order they are listed in indicates the drawing order, as some elements
may overlap and not be seen in each image:
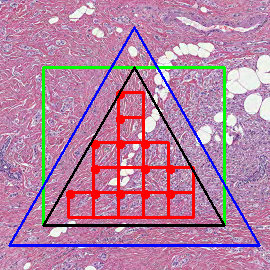
Calculated patches and optionally patch markers - red.
Bounding boxes for polygons or polygon buffers - lime.
Polygons or one polygon representing the whole image - blue.
Polygon holes (used in inverted patch classes) - teal.
Polygon buffers - black.
Additional notes:
Patch markers are represented by small red circles placed in the top left corner of each calculated patch.
Each drawn element can be turned off individually by setting its color value to None.
Both
drawn_labelsanddrawn_patches_labelsprovide label level filtering of the drawn content, however the former parameter takes precedence over the latter.level_or_minsizecontrols the dimensions of the saved image, if not specified then the image dimensions will match the dimensions of the provided mask.